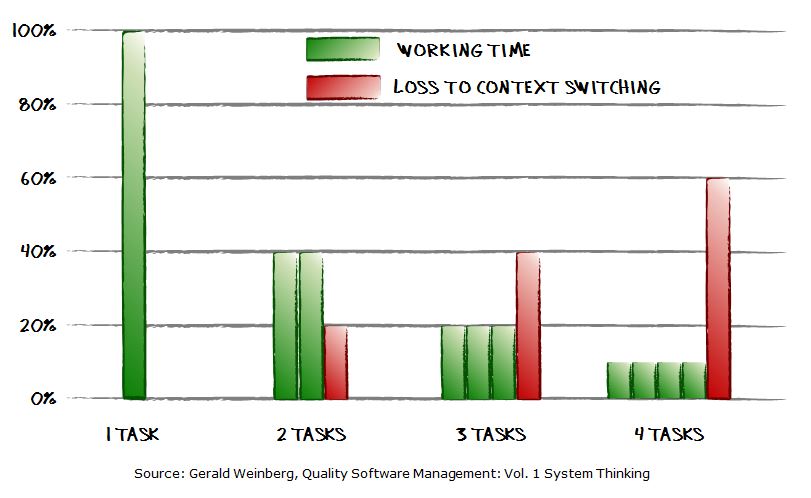
Here is a nice chart to illustrate the idea:
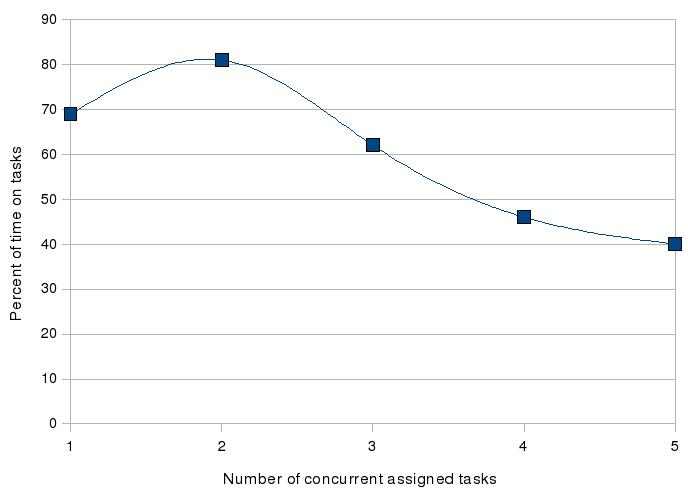
Obviously, the above is more of a rule of thumb and here is a nice summarisation. However, there was another study on the matter by Harward’s professors S.Wheelwright and K.Clark that draw slightly different picture:
What’s important here is that the percent of time on tasks or performance actually maximises at 2 concurrent tasks. This is actually much more in line with my personal observations. You can also argue that in the field of SA we often have tasks that require significant amount of “wait time” when you kick something off and then simply wait for it to complete, so the latter graph has even more sense.

